Lecture 5
If a change in some factor shifts the supply curve to the right, it corresponds to an increase in supply (and a shift to the left corresponds to a decrease in supply). What are the factors that can cause a shift in the curve?
- Input Prices - If the prices of goods that serve as input (say sugar for ice-cream) in making the good increase, then the curve shifts to the left.
- Technology - If the technology advances, the curve shifts to the right.
- Expectations - If the price of some good is expected (by the firm) to increase in the future, the curve shifts to the left because they start hoarding the product. This assumes the good is durable. If it is perishable then we need to sell it by the expiry date anyway.
- Number of sellers - If the number of sellers increases, the curve shifts to the right.
The supply (demand) curve does not take demand (supply) into consideration explicitly, but they are intrinsically linked.
Equilibrium is the situation where the quantity supplied is equal to the quantity demanded. The equilibrium price and equilibtium quantity are the corresponding price and quantity. Observe that this is just the point of intersection of the supply and demand curves. The equilibrium price is also known as the “market-clearing price”.
If the price is higher than the equilibrium price, then the supply is high and the demand is low. This is known as an excess-supply situation. The excess supply is known as a surplus. Since the sellers need to clear their excess, the price decreases until the equilibrium is reached.
Similarly, if the price is lower than the equilibrium price, we are in an excess-demand situation. The excess demand is known as a shortage. Here, the sellers realize that they need to sell more and they drive up the price until the equilibrium is reached.
Therefore, regardless of how the original situation is, we converge to the equilibrium assuming there are no barriers to this. This phenomenon is known as the law of supply and demand - the price of any good adjusts to bring the quantity supplied and demanded into balance.
Note that this phenomenon is just Adam Smith’s “invisible hand” mentioned in the first lecture and the price system is how it influences the economy. Also note that the equilibrium is determined by both the supply and demand curves, not just one of them.
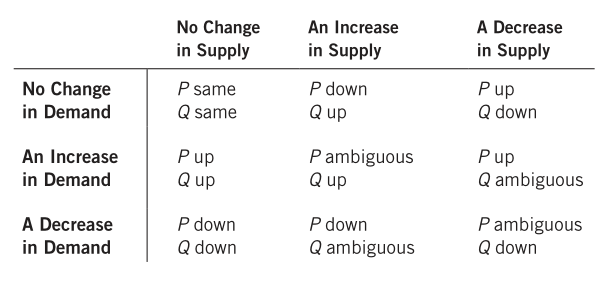
The earlier discussion about shifts of the supply and demand curves can be used to analyze the shift in equilibria as well. The following table describes how it changes with shift in the curves.
As an aside, it is worth noting that in digital markets, since information transfer is very fast, it doesn’t take too long to attain the new equilibrium if the equilibrium shifts.