Lecture 3
Microeconomics focuses on the individual parts of the economy and how households/firms make decisions and interact in specific markets, whereas macroeconomics looks at the economy as a whole, looking at economy-wide phenomena such as inflation, unemployment, and economic growth.
Since macroeconomics is essentially made up of a large number of microeconomic systems, it is impossible to understand the former without the latter.
Positive statements are descriptive and attempt to describe the world as it is, whereas normative statements are prescriptive and are statements about how the world should be.
The validity of positive statements can be decided by observing the facts already present, whereas the validity of normative statements are far more subjective in nature.
Economists may disagree about the validity of different positive theories on how the world works. They may also have different ideals and thus different normative views.
A market is a group of buyers and sellers of a particular good/service.
A competitive market is one where are there are many buyers and sellers so that each has a negligible impact on the market price. A seller has little reason to sell at a lower price than the market price and he cannot sell at a higher price because then, buyers will go elsewhere. In perfectly competitive markets (all the goods are the same and no individual buyer/seller can influence the market), buyers and sellers are said to be price takers.
A monopoly on the other end of the spectrum is is a single seller who sets the price.
An oligopoly means there are not many sellers and the competition is not very aggressive. For example, the telecom market.
Monopolistic competition (monopoly+competition) has many sellers and slightly differentiated products. Each seller may set price for its own product. For example, the hotel market.
The quantity demanded is the amount of a good that buyers are willing and able to purchase.
The law of demand states that, other things equal, the quantity demanded of a good falls when the price of the good rises.
The law of demand doesn’t always hold. For example, in the stock market, the usual rule of thumb is to buy more when the price of the stocks increases. Another example is paintings/antiques in auctions.
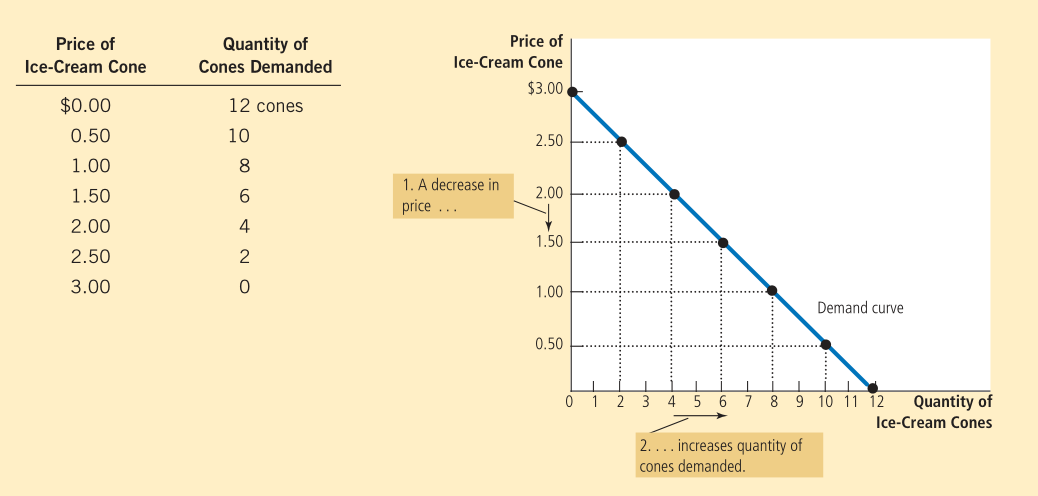
The demand schedule is a table showing the relation between the price and the quantity demanded. When the law of demand holds, the two have an inverse relationship.
The demand curve is a graph of the two (with the price on vertical axis and the quantity demanded on the horizontal).
The following is an example of a demand schedule and curve (following the law of demand).